Plots
ScanPlot
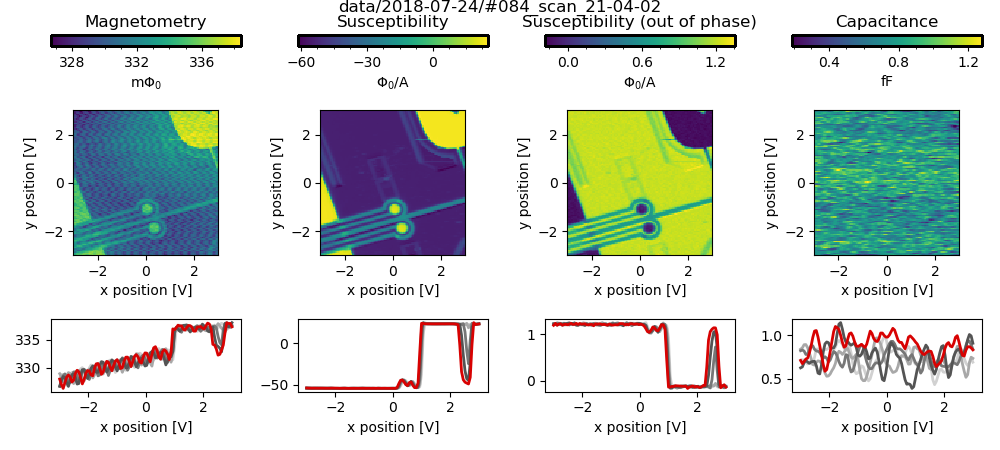
This is the plot that is displayed during the course of a scan. It shows magnetometry, susceptibility (in and out of phase), and cantilever capacitance data as a function of x,y scanner voltage in the units requested in the Measurement Configuration file. The plot is saved as a png file to the DataSet location after each line of the scan. The last five lines of data are displayed below the colorplot, with the most recent line in red.
- class
plots.ScanPlot(scan_params: Dict[str, Any], ureg: Any, **kwargs)[source]¶Plot displaying acquired images in all measurement channels, updated live during a scan.
- Parameters
scan_params – Scan parameters as defined in measurement configuration file.
prefactors – Dict of pint quantities defining conversion factor from DAQ voltage to real units for each measurement channel.
ureg – pint UnitRegistry, manages units.
init_empty()[source]¶Initialize the plot with all images empty. They will be filled during the scan.
save(fname=None)[source]¶Save plot to png file.
- Parameters
fname – File to which to save the plot. If fname is None, saves to data location as {scan_params[‘fname’]}.png
update(data_set: Any, loop_counter: Any, num_lines: Optional[int] = 5, offline: Optional[bool] = False) → None[source]¶Update the plot with updated DataSet. Called after each line of the scan.
- Parameters
DataSet – active data set, with a new line of data added with each loop iteration.
loop_counter – utils.Counter instance, lets us know where we are in the scan.
num_lines – Number of previous linecuts to plot, including the line just scanned. Currently can only handle num_lines <= 5.
offline – False if this is being called during a scan.
TDCPlot
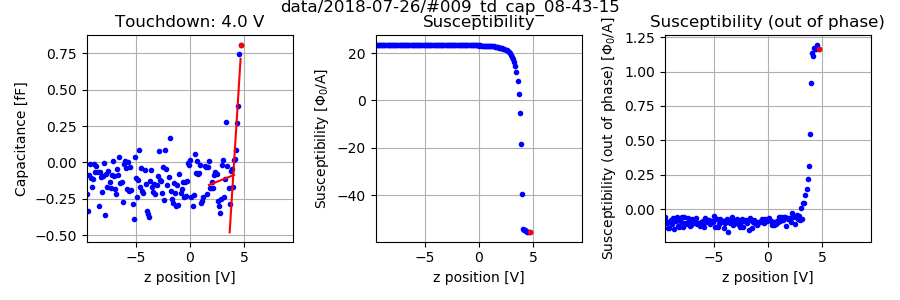
This is the plot that is displayed during a touchdown. It shows cantilever capacitance and susceptibility (in and out of phase) as a function of z scanner voltage in the units requested in the Measurement Configuration file. The plot is saved as a png file to the DataSet location at the end of the measurement.
- class
plots.TDCPlot(tdc_params: Dict[str, Any], ureg: Any)[source]¶Plot displaying capacitance as a function of z voltage, updated live during a scan.
- Parameters
tdc_params – Touchdown parameters as defined in measurement configuration file.
ureg – pint UnitRegistry, manages units.